Jump to Week:
1 |
2 |
3 |
4 |
5 |
6 |
7 |
8 |
9 |
10 |
11 |
12 |
13 |
14 |
15 |
16 |
17 |
18 |
19 |
20 |
21 |
22 |
23 |
24 |
25 |
26 |
27 |
28 |
29 |
30 |
31 |
32 |
33 |
34 |
35 |
36 |
37 |
38 |
39 |
40 |
41 |
42 |
43 |
44 |
45 |
46 |
47 |
48 |
49 |
50 |
51 |
52
Note: All data presented for informational purposes only. BroadwayWorld.com makes no guarantees as to the accuracy of the data, or the matter in which it's presented. Source: The Broadway League..
| YEAR | Total Gross | Avg. Gross | Average Ticket | Top Ticket | Seats Sold |
Total Seats |
Shows | Perf. | Average % |
| 1996 | $8,510,377 | $327,322 | $42.88 | $75.00 | 181,655 | 238,755 | 26 | 190 | 76.32% |
| 1997 | $9,773,057 | $361,965 | $45.11 | $75.00 | 202,316 | 266,262 | 27 | 209 | 75.61% |
| 1998 | $11,082,905 | $382,169 | $46.88 | $80.00 | 228,777 | 286,465 | 29 | 223 | 78.13% |
| 1999 | $11,675,418 | $376,626 | $48.24 | $90.00 | 232,027 | 311,093 | 31 | 240 | 74.56% |
| 2000 | $12,543,459 | $418,115 | $54.35 | $90.00 | 225,664 | 294,018 | 30 | 231 | 76.83% |
| 2001 | $13,318,882 | $493,292 | $60.32 | $100.00 | 210,036 | 254,826 | 27 | 208 | 81.50% |
| 2002 | $14,073,029 | $453,969 | $60.78 | $480.00 | 216,884 | 293,680 | 31 | 232 | 72.09% |
| 2003 | $14,727,454 | $420,784 | $60.71 | $480.00 | 228,188 | 327,606 | 35 | 269 | 67.42% |
| 2004 | $13,888,888 | $448,029 | $60.92 | $251.25 | 212,933 | 293,967 | 31 | 235 | 70.84% |
| 2005 | $17,023,015 | $549,130 | $66.23 | $301.25 | 242,449 | 303,037 | 31 | 246 | 78.74% |
| 2006 | $18,691,741 | $566,416 | $71.24 | $301.25 | 246,834 | 319,372 | 33 | 258 | 76.49% |
| 2007 | $4,297,988 | $537,248 | $71.39 | $250.00 | 56,867 | 69,831 | 8 | 66 | 82.30% |
| 2008 | $16,602,724 | $535,572 | $73.16 | $350.00 | 215,757 | 304,211 | 31 | 244 | 70.47% |
| 2009 | $19,622,534 | $594,622 | $77.54 | $375.00 | 237,391 | 322,778 | 33 | 263 | 73.23% |
| 2010 | $21,333,678 | $561,413 | $78.96 | $350.00 | 255,508 | 360,160 | 38 | 301 | 71.03% |
| 2011 | $22,924,362 | $674,246 | $86.33 | $475.00 | 250,983 | 326,019 | 34 | 264 | 78.24% |
| 2012 | $20,881,277 | $632,766 | $83.28 | $477.00 | 236,771 | 315,078 | 33 | 259 | 75.47% |
| 2013 | $23,426,996 | $732,094 | $95.47 | $477.00 | 233,393 | 297,352 | 32 | 251 | 78.54% |
| 2014 | $26,699,452 | $741,651 | $98.32 | $477.00 | 262,452 | 334,592 | 36 | 285 | 79.01% |
| 2015 | $26,940,627 | $708,964 | $95.62 | $477.00 | 268,155 | 358,109 | 38 | 295 | 74.64% |
| 2016 | $26,762,456 | $836,327 | $101.20 | $549.00 | 252,921 | 308,772 | 32 | 254 | 82.34% |
| 2017 | $31,147,317 | $1,004,752 | $124.67 | $850.00 | 247,644 | 287,698 | 31 | 239 | 86.47% |
| 2018 | $43,043,393 | $1,195,650 | $133.25 | $849.00 | 299,235 | 349,472 | 36 | 287 | 85.09% |
| 2019 | $32,015,929 | $914,741 | $109.02 | $847.00 | 278,056 | 327,758 | 35 | 277 | 83.95% |
| 2022 | $30,912,719 | $909,198 | $108.23 | $599.00 | 260,973 | 315,770 | 34 | 265 | 81.23% |
| 2023 | $27,060,113 | $933,107 | $115.90 | $599.00 | 228,423 | 266,268 | 29 | 225 | 85.78% |
Note: All data presented for informational purposes only. BroadwayWorld.com makes no guarantees as to the accuracy of the data, or the matter in which it's presented. Source: The Broadway League..
Videos
 |
Thumbelina: A Little Musical
Wychwood Theatre (5/4 - 6/23)
PHOTOS
VIDEOS
| |
 |
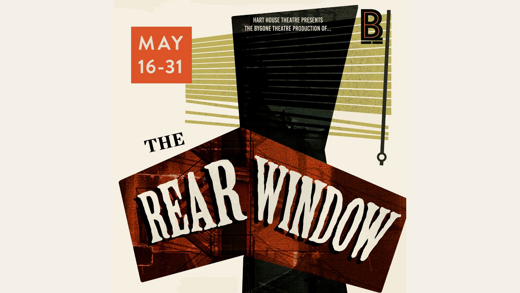
The Rear Window
Hart House Theatre (5/15 - 5/31) | |

|
Hadestown
Ed Mirvish Theatre (5/15 - 5/26) | |

|
FREEDOM! A Tribute to Aretha Franklin
Toronto Symphony Orchestra (5/21 - 5/22) | |

|
A Goat, A Ghost and A Guinness
The Al Green Theatre (5/16 - 5/19) | |

|
Shrek the Musical (Non-Equity)
Princess of Wales Theatre (8/6 - 8/18) | |

|
The Glory of Living: A play by Rebecca Gilman
The King Black Box (5/16 - 5/31) | |

|
Harbourfront Centre Celebrates 50 Years of Arts, Culture and Unity with an Exciting Summer Lineup of Anniversary Events and Long Weekend Festivals
Harbourfront Centre (6/1 - 8/28) | |

|
The Rocky Horror Show
Scarborough Village Theatre (5/9 - 5/25) | |
| VIEW SHOWS ADD A SHOW | ||
Recommended For You


