Jump to Week:
1 |
2 |
3 |
4 |
5 |
6 |
7 |
8 |
9 |
10 |
11 |
12 |
13 |
14 |
15 |
16 |
17 |
18 |
19 |
20 |
21 |
22 |
23 |
24 |
25 |
26 |
27 |
28 |
29 |
30 |
31 |
32 |
33 |
34 |
35 |
36 |
37 |
38 |
39 |
40 |
41 |
42 |
43 |
44 |
45 |
46 |
47 |
48 |
49 |
50 |
51 |
52
Note: All data presented for informational purposes only. BroadwayWorld.com makes no guarantees as to the accuracy of the data, or the matter in which it's presented. Source: The Broadway League..
| YEAR | Total Gross | Avg. Gross | Average Ticket | Top Ticket | Seats Sold |
Total Seats |
Shows | Perf. | Average % |
| 1996 | $9,964,586 | $398,583 | $43.51 | $75.00 | 214,696 | 94,483 | 25 | 193 | 33.55% |
| 1997 | $9,542,754 | $307,831 | $41.06 | $75.00 | 215,972 | 291,020 | 31 | 243 | 72.26% |
| 1998 | $12,185,399 | $380,794 | $44.94 | $75.00 | 248,988 | 310,730 | 32 | 252 | 77.91% |
| 1999 | $14,525,252 | $440,159 | $47.83 | $100.00 | 287,133 | 327,838 | 33 | 262 | 86.39% |
| 2000 | $14,242,912 | $406,940 | $50.25 | $90.00 | 273,754 | 342,859 | 35 | 269 | 78.80% |
| 2001 | $15,554,136 | $444,404 | $52.20 | $91.00 | 283,796 | 345,148 | 35 | 275 | 80.41% |
| 2002 | $12,679,862 | $396,246 | $56.20 | $480.00 | 210,680 | 291,634 | 32 | 240 | 68.99% |
| 2003 | $12,750,063 | $411,292 | $56.76 | $480.00 | 204,873 | 290,123 | 31 | 236 | 70.45% |
| 2004 | $17,577,340 | $585,911 | $62.40 | $480.00 | 268,213 | 306,122 | 30 | 236 | 85.57% |
| 2005 | $16,542,363 | $486,540 | $63.07 | $240.00 | 250,511 | 327,250 | 34 | 263 | 74.40% |
| 2006 | $18,391,898 | $540,938 | $67.72 | $301.25 | 259,175 | 317,872 | 34 | 261 | 80.26% |
| 2007 | $22,462,312 | $623,953 | $71.13 | $351.50 | 299,749 | 345,298 | 36 | 276 | 84.55% |
| 2008 | $18,543,795 | $561,933 | $70.39 | $351.50 | 250,387 | 315,231 | 33 | 250 | 78.25% |
| 2009 | $21,432,403 | $630,365 | $70.84 | $350.00 | 273,564 | 317,624 | 34 | 263 | 82.89% |
| 2010 | $22,531,015 | $682,758 | $79.28 | $350.00 | 267,431 | 315,522 | 33 | 253 | 82.15% |
| 2011 | $23,247,078 | $596,079 | $72.92 | $350.00 | 303,550 | 379,171 | 39 | 308 | 78.90% |
| 2012 | $27,986,522 | $717,603 | $83.57 | $477.00 | 299,763 | 362,450 | 39 | 297 | 81.02% |
| 2013 | $23,143,560 | $723,236 | $87.11 | $477.00 | 252,058 | 305,409 | 32 | 250 | 82.79% |
| 2014 | $28,579,887 | $772,429 | $93.06 | $477.00 | 288,358 | 338,727 | 37 | 288 | 84.33% |
| 2015 | $29,465,955 | $841,884 | $93.79 | $497.00 | 296,999 | 332,214 | 35 | 276 | 89.31% |
| 2016 | $26,894,101 | $747,058 | $92.87 | $477.00 | 274,288 | 342,441 | 36 | 284 | 80.55% |
| 2017 | $35,186,717 | $879,668 | $101.52 | $849.00 | 319,841 | 367,757 | 40 | 306 | 86.48% |
| 2018 | $37,729,080 | $1,048,030 | $121.83 | $850.00 | 311,621 | 347,770 | 36 | 282 | 89.93% |
| 2019 | $34,725,461 | $964,596 | $109.44 | $849.00 | 304,463 | 333,294 | 36 | 284 | 91.40% |
| 2021 | $1,897,070 | $632,357 | $128.94 | $399.00 | 14,599 | 20,000 | 3 | 18 | 82.30% |
| 2022 | $28,329,869 | $913,867 | $114.56 | $597.00 | 225,256 | 259,943 | 31 | 220 | 86.23% |
| 2023 | $38,594,054 | $1,169,517 | $125.66 | $699.00 | 280,760 | 301,788 | 33 | 253 | 91.22% |
| 2024 | $35,535,214 | $987,089 | $118.39 | $649.00 | 292,028 | 320,990 | 36 | 276 | 91.16% |
Note: All data presented for informational purposes only. BroadwayWorld.com makes no guarantees as to the accuracy of the data, or the matter in which it's presented. Source: The Broadway League..
Videos
 |
Thumbelina: A Little Musical
Wychwood Theatre (5/4 - 6/23)
PHOTOS
VIDEOS
| |
 |
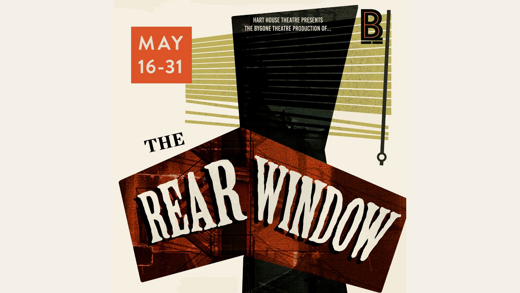
The Rear Window
Hart House Theatre (5/15 - 5/31) | |

|
Hadestown
Ed Mirvish Theatre (5/15 - 5/26) | |

|
FREEDOM! A Tribute to Aretha Franklin
Toronto Symphony Orchestra (5/21 - 5/22) | |

|
A Goat, A Ghost and A Guinness
The Al Green Theatre (5/16 - 5/19) | |

|
Shrek the Musical (Non-Equity)
Princess of Wales Theatre (8/6 - 8/18) | |

|
The Glory of Living: A play by Rebecca Gilman
The King Black Box (5/16 - 5/31) | |

|
Harbourfront Centre Celebrates 50 Years of Arts, Culture and Unity with an Exciting Summer Lineup of Anniversary Events and Long Weekend Festivals
Harbourfront Centre (6/1 - 8/28) | |

|
The Rocky Horror Show
Scarborough Village Theatre (5/9 - 5/25) | |
| VIEW SHOWS ADD A SHOW | ||
Recommended For You


