Jump to Week:
1 |
2 |
3 |
4 |
5 |
6 |
7 |
8 |
9 |
10 |
11 |
12 |
13 |
14 |
15 |
16 |
17 |
18 |
19 |
20 |
21 |
22 |
23 |
24 |
25 |
26 |
27 |
28 |
29 |
30 |
31 |
32 |
33 |
34 |
35 |
36 |
37 |
38 |
39 |
40 |
41 |
42 |
43 |
44 |
45 |
46 |
47 |
48 |
49 |
50 |
51 |
52
Note: All data presented for informational purposes only. BroadwayWorld.com makes no guarantees as to the accuracy of the data, or the matter in which it's presented. Source: The Broadway League..
| YEAR | Total Gross | Avg. Gross | Average Ticket | Top Ticket | Seats Sold |
Total Seats |
Shows | Perf. | Average % |
| 1996 | $5,837,372 | $389,158 | $43.63 | $75.00 | 130,323 | 39,054 | 15 | 118 | 20.98% |
| 1997 | $7,454,713 | $438,513 | $46.52 | $75.00 | 156,239 | 183,271 | 17 | 135 | 84.90% |
| 1998 | $10,640,113 | $394,078 | $45.47 | $80.00 | 227,966 | 273,240 | 27 | 212 | 82.16% |
| 1999 | $11,054,902 | $425,189 | $46.91 | $80.00 | 234,336 | 274,256 | 26 | 208 | 85.87% |
| 2000 | $11,306,129 | $434,851 | $53.08 | $90.00 | 210,296 | 266,988 | 26 | 206 | 79.28% |
| 2001 | $10,539,214 | $421,569 | $54.84 | $90.00 | 188,668 | 246,908 | 25 | 198 | 75.74% |
| 2002 | $9,603,286 | $533,516 | $58.96 | $480.00 | 154,196 | 176,974 | 18 | 134 | 87.10% |
| 2003 | $15,108,718 | $503,624 | $60.39 | $480.00 | 237,013 | 305,970 | 30 | 239 | 77.37% |
| 2004 | $13,964,707 | $517,211 | $65.71 | $480.00 | 202,972 | 273,362 | 27 | 214 | 74.10% |
| 2005 | $13,774,614 | $550,985 | $64.96 | $240.00 | 204,441 | 244,271 | 25 | 194 | 83.01% |
| 2006 | $15,708,687 | $654,529 | $72.71 | $301.25 | 207,596 | 235,043 | 24 | 185 | 88.40% |
| 2007 | $14,777,463 | $547,313 | $71.40 | $301.25 | 198,004 | 267,006 | 27 | 211 | 74.86% |
| 2008 | $16,271,060 | $542,369 | $70.70 | $351.50 | 218,666 | 287,531 | 30 | 239 | 74.80% |
| 2009 | $13,882,638 | $661,078 | $74.31 | $350.00 | 181,814 | 215,112 | 21 | 168 | 83.76% |
| 2010 | $17,589,763 | $703,591 | $81.57 | $350.00 | 209,117 | 248,220 | 25 | 199 | 85.02% |
| 2011 | $14,896,892 | $709,376 | $84.61 | $350.00 | 170,093 | 214,092 | 21 | 166 | 79.36% |
| 2012 | $20,901,347 | $720,736 | $86.82 | $477.00 | 229,469 | 283,253 | 29 | 227 | 80.91% |
| 2013 | $19,579,647 | $783,186 | $97.74 | $700.00 | 196,399 | 241,426 | 25 | 193 | 81.61% |
| 2014 | $20,091,734 | $772,759 | $96.03 | $477.00 | 196,042 | 230,585 | 26 | 203 | 84.80% |
| 2015 | $24,414,291 | $841,872 | $103.00 | $475.00 | 236,545 | 273,012 | 29 | 230 | 87.63% |
| 2016 | $26,239,269 | $846,428 | $98.73 | $477.00 | 257,867 | 307,846 | 31 | 246 | 84.38% |
| 2017 | $25,872,048 | $1,034,882 | $111.60 | $549.00 | 225,416 | 246,856 | 25 | 199 | 92.10% |
| 2018 | $27,685,189 | $1,025,377 | $129.85 | $850.00 | 217,004 | 239,036 | 27 | 206 | 91.44% |
| 2019 | $31,699,190 | $1,022,555 | $114.23 | $849.00 | 267,598 | 302,377 | 31 | 247 | 89.25% |
| 2020 | $30,443,388 | $1,127,533 | $120.83 | $847.00 | 248,005 | 261,028 | 27 | 212 | 95.11% |
| 2022 | $18,496,688 | $739,868 | $102.70 | $697.00 | 162,566 | 244,642 | 25 | 196 | 67.16% |
| 2023 | $33,859,988 | $1,167,586 | $129.20 | $878.00 | 247,667 | 265,660 | 29 | 227 | 92.78% |
| 2024 | $23,589,174 | $943,567 | $113.98 | $649.00 | 204,612 | 236,846 | 25 | 199 | 86.04% |
Note: All data presented for informational purposes only. BroadwayWorld.com makes no guarantees as to the accuracy of the data, or the matter in which it's presented. Source: The Broadway League..
Videos
 |
Thumbelina: A Little Musical
Wychwood Theatre (5/4 - 6/23)
PHOTOS
VIDEOS
| |
 |
The Rear Window
Hart House Theatre (5/15 - 5/31) | |

|
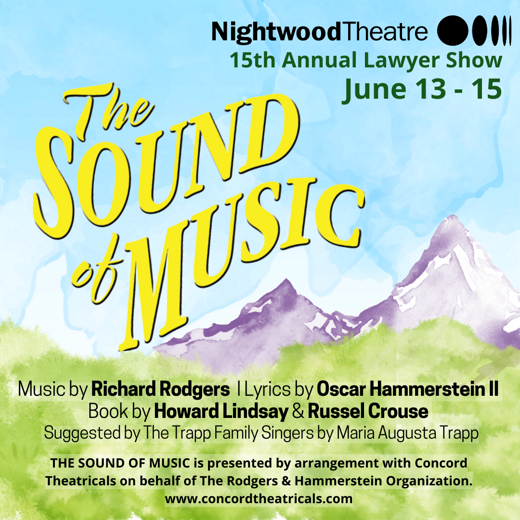
Nightwood Theatre's 2024 Lawyer Show: The Sound of Music
The St. Lawrence Centre for the Arts (6/13 - 6/15) | |

|
A Year with Frog and Toad
Capitol Theatre Port Hope (5/17 - 6/2) | |

|
Harbourfront Centre Celebrates 50 Years of Arts, Culture and Unity with an Exciting Summer Lineup of Anniversary Events and Long Weekend Festivals
Harbourfront Centre (6/1 - 8/28) | |

|
Elephant and Piggie's We are in a Play!
Randolph Theatre (6/15 - 7/7)
PHOTOS
VIDEOS
| |

|
Swipes Right: Back on the Apps
The Second City (1/8 - 6/29) | |

|
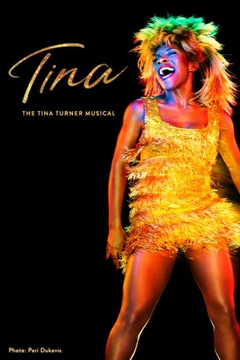
Tina: The Tina Turner Musical
Ed Mirvish Theatre (6/18 - 7/28) | |

|
SPIN - in concert
Guild Festival Theatre (7/6 - 7/6) | |
| VIEW SHOWS ADD A SHOW | ||
Recommended For You


