

Jump to Week:
1 |
2 |
3 |
4 |
5 |
6 |
7 |
8 |
9 |
10 |
11 |
12 |
13 |
14 |
15 |
16 |
17 |
18 |
19 |
20 |
21 |
22 |
23 |
24 |
25 |
26 |
27 |
28 |
29 |
30 |
31 |
32 |
33 |
34 |
35 |
36 |
37 |
38 |
39 |
40 |
41 |
42 |
43 |
44 |
45 |
46 |
47 |
48 |
49 |
50 |
51 |
52
Note: All data presented for informational purposes only. BroadwayWorld.com makes no guarantees as to the accuracy of the data, or the matter in which it's presented. Source: The Broadway League..
| YEAR | Total Gross | Avg. Gross | Average Ticket | Top Ticket | Seats Sold |
Total Seats |
Shows | Perf. | Average % |
| 1996 | $8,558,713 | $372,118 | $44.13 | $75.00 | 182,427 | 219,775 | 23 | 173 | 83.40% |
| 1997 | $8,052,104 | $383,434 | $48.08 | $75.00 | 164,844 | 209,222 | 21 | 167 | 79.47% |
| 1998 | $8,243,062 | $433,845 | $50.74 | $75.00 | 158,803 | 199,804 | 19 | 147 | 79.07% |
| 1999 | $8,749,470 | $380,412 | $47.79 | $90.00 | 171,057 | 233,376 | 23 | 184 | 71.40% |
| 2000 | $9,672,512 | $439,660 | $55.88 | $90.00 | 169,355 | 239,448 | 22 | 176 | 72.01% |
| 2001 | $10,010,718 | $500,536 | $55.02 | $100.00 | 175,887 | 204,944 | 20 | 156 | 86.55% |
| 2002 | $12,883,395 | $495,515 | $59.54 | $480.00 | 203,451 | 257,610 | 26 | 207 | 78.28% |
| 2003 | $11,160,447 | $531,450 | $63.44 | $480.00 | 170,594 | 208,629 | 21 | 159 | 81.27% |
| 2004 | $11,250,841 | $468,785 | $60.11 | $251.25 | 174,577 | 235,088 | 24 | 181 | 71.70% |
| 2005 | $12,352,143 | $537,050 | $63.93 | $301.25 | 182,349 | 222,340 | 23 | 174 | 79.17% |
| 2006 | $15,081,815 | $628,409 | $72.93 | $301.25 | 194,832 | 238,504 | 24 | 192 | 80.35% |
| 2007 | $16,044,883 | $641,795 | $74.94 | $351.50 | 204,293 | 243,612 | 25 | 196 | 82.47% |
| 2008 | $16,587,237 | $552,908 | $71.89 | $350.00 | 217,949 | 287,290 | 30 | 232 | 74.48% |
| 2009 | $17,947,579 | $640,985 | $76.40 | $375.00 | 218,282 | 263,772 | 28 | 217 | 82.58% |
| 2010 | $17,278,362 | $617,084 | $72.70 | $350.00 | 222,529 | 279,848 | 28 | 224 | 79.60% |
| 2011 | $18,748,191 | $852,190 | $88.71 | $475.00 | 207,794 | 238,856 | 22 | 176 | 87.20% |
| 2012 | $17,166,466 | $780,294 | $87.84 | $477.00 | 184,210 | 214,943 | 22 | 172 | 86.19% |
| 2013 | $21,422,658 | $765,095 | $92.35 | $477.00 | 215,124 | 261,536 | 28 | 220 | 82.24% |
| 2014 | $23,249,659 | $726,552 | $92.26 | $477.00 | 242,265 | 298,877 | 32 | 249 | 81.54% |
| 2015 | $21,226,522 | $758,090 | $93.93 | $477.00 | 210,902 | 254,315 | 28 | 214 | 82.26% |
| 2016 | $22,824,772 | $787,061 | $96.09 | $549.00 | 225,806 | 282,890 | 29 | 219 | 81.63% |
| 2017 | $23,206,324 | $966,930 | $108.65 | $849.00 | 198,483 | 236,096 | 24 | 192 | 84.10% |
| 2018 | $33,381,111 | $1,043,160 | $130.71 | $850.00 | 249,245 | 282,559 | 32 | 238 | 88.13% |
| 2019 | $30,098,714 | $912,082 | $107.73 | $847.00 | 261,793 | 298,555 | 33 | 255 | 87.09% |
| 2022 | $25,208,583 | $1,008,343 | $113.29 | $599.00 | 209,668 | 240,192 | 25 | 200 | 86.40% |
| 2023 | $23,116,749 | $889,106 | $110.25 | $499.00 | 199,458 | 237,824 | 26 | 202 | 83.16% |
Note: All data presented for informational purposes only. BroadwayWorld.com makes no guarantees as to the accuracy of the data, or the matter in which it's presented. Source: The Broadway League..
Videos
 |
Thumbelina: A Little Musical
Wychwood Theatre (5/4 - 6/23)
PHOTOS
VIDEOS
| |
 |
The Rear Window
Hart House Theatre (5/15 - 5/31) | |

|
Hadestown
Ed Mirvish Theatre (5/15 - 5/26) | |
|
FREEDOM! A Tribute to Aretha Franklin
Toronto Symphony Orchestra (5/21 - 5/22) | |
|
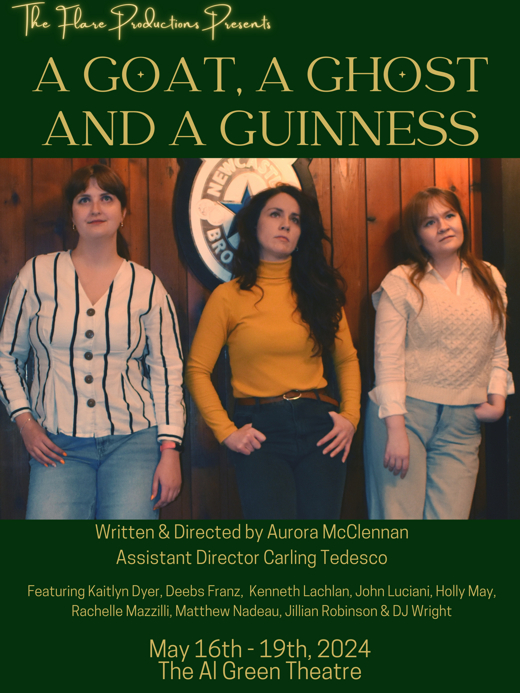
A Goat, A Ghost and A Guinness
The Al Green Theatre (5/16 - 5/19) | |

|
Shrek the Musical (Non-Equity)
Princess of Wales Theatre (8/6 - 8/18) | |
|
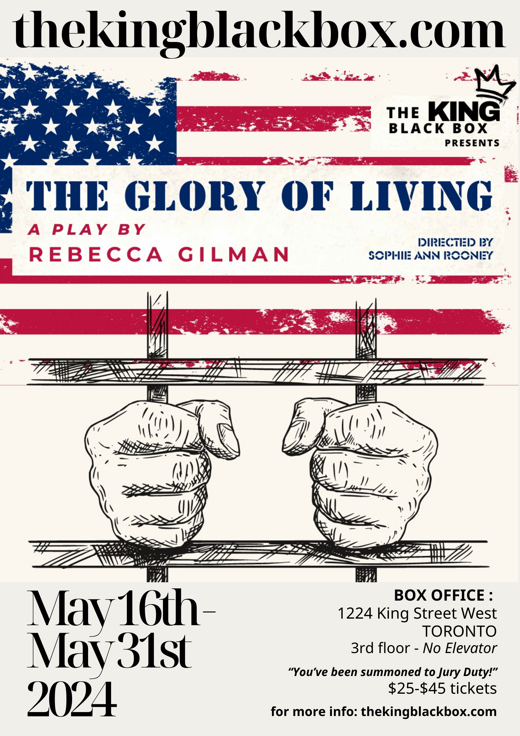
The Glory of Living: A play by Rebecca Gilman
The King Black Box (5/16 - 5/31) | |

|
Harbourfront Centre Celebrates 50 Years of Arts, Culture and Unity with an Exciting Summer Lineup of Anniversary Events and Long Weekend Festivals
Harbourfront Centre (6/1 - 8/28) | |

|
The Rocky Horror Show
Scarborough Village Theatre (5/9 - 5/25) | |
| VIEW SHOWS ADD A SHOW | ||
Recommended For You
Get Toronto's #1 Newsletter
Get the best news & discounts for Toronto & beyond.