Jump to Week:
1 |
2 |
3 |
4 |
5 |
6 |
7 |
8 |
9 |
10 |
11 |
12 |
13 |
14 |
15 |
16 |
17 |
18 |
19 |
20 |
21 |
22 |
23 |
24 |
25 |
26 |
27 |
28 |
29 |
30 |
31 |
32 |
33 |
34 |
35 |
36 |
37 |
38 |
39 |
40 |
41 |
42 |
43 |
44 |
45 |
46 |
47 |
48 |
49 |
50 |
51 |
52
Note: All data presented for informational purposes only. BroadwayWorld.com makes no guarantees as to the accuracy of the data, or the matter in which it's presented. Source: The Broadway League..
| YEAR | Total Gross | Avg. Gross | Average Ticket | Top Ticket | Seats Sold |
Total Seats |
Shows | Perf. | Average % |
| 1996 | $6,060,316 | $404,021 | $43.41 | $75.00 | 134,578 | 39,054 | 15 | 117 | 21.64% |
| 1997 | $7,329,699 | $407,206 | $45.85 | $75.00 | 154,032 | 185,971 | 18 | 141 | 83.46% |
| 1998 | $10,110,695 | $361,096 | $44.10 | $80.00 | 217,487 | 282,410 | 28 | 220 | 75.72% |
| 1999 | $10,318,401 | $396,862 | $46.95 | $80.00 | 215,118 | 261,234 | 26 | 202 | 81.06% |
| 2000 | $9,366,162 | $390,257 | $52.68 | $90.00 | 175,143 | 242,796 | 24 | 190 | 72.87% |
| 2001 | $10,502,008 | $437,584 | $55.03 | $90.00 | 186,458 | 239,040 | 24 | 191 | 77.15% |
| 2002 | $9,625,269 | $506,593 | $57.17 | $480.00 | 158,263 | 186,116 | 19 | 145 | 85.36% |
| 2003 | $13,352,356 | $430,721 | $58.00 | $480.00 | 217,940 | 311,340 | 31 | 244 | 69.18% |
| 2004 | $12,494,401 | $480,554 | $63.86 | $480.00 | 184,705 | 268,796 | 26 | 204 | 67.93% |
| 2005 | $11,606,178 | $464,247 | $62.26 | $240.00 | 178,432 | 246,221 | 25 | 197 | 71.22% |
| 2006 | $14,167,173 | $566,687 | $72.53 | $301.25 | 190,309 | 240,993 | 25 | 195 | 79.80% |
| 2007 | $14,490,554 | $557,329 | $71.28 | $301.25 | 194,268 | 263,824 | 26 | 208 | 73.32% |
| 2008 | $14,451,086 | $481,703 | $68.30 | $351.50 | 200,948 | 287,079 | 30 | 236 | 69.04% |
| 2009 | $12,684,919 | $576,587 | $71.70 | $350.00 | 169,367 | 219,067 | 22 | 175 | 76.51% |
| 2010 | $14,269,367 | $620,407 | $78.92 | $350.00 | 174,640 | 227,584 | 23 | 184 | 78.26% |
| 2011 | $12,343,580 | $649,662 | $82.65 | $350.00 | 143,923 | 198,262 | 19 | 151 | 72.13% |
| 2012 | $19,345,315 | $690,904 | $82.87 | $477.00 | 219,745 | 280,112 | 28 | 224 | 78.88% |
| 2013 | $17,182,846 | $781,038 | $91.29 | $477.00 | 182,952 | 218,003 | 22 | 170 | 84.65% |
| 2014 | $19,122,431 | $735,478 | $90.58 | $477.00 | 198,773 | 235,493 | 26 | 207 | 83.55% |
| 2015 | $21,336,323 | $790,234 | $99.98 | $475.00 | 212,288 | 252,283 | 27 | 211 | 84.93% |
| 2016 | $15,977,962 | $515,418 | $87.35 | $477.00 | 174,717 | 226,231 | 31 | 180 | 78.08% |
| 2017 | $21,686,421 | $985,746 | $107.06 | $549.00 | 198,085 | 223,616 | 22 | 176 | 89.91% |
| 2018 | $27,522,166 | $1,058,545 | $127.63 | $850.00 | 221,748 | 241,520 | 26 | 204 | 91.87% |
| 2019 | $29,982,380 | $1,033,875 | $112.46 | $849.00 | 259,574 | 281,609 | 29 | 231 | 92.56% |
| 2020 | $27,611,966 | $1,104,479 | $115.39 | $847.00 | 238,179 | 250,495 | 25 | 196 | 95.11% |
| 2022 | $16,489,941 | $785,235 | $101.10 | $697.00 | 152,135 | 201,931 | 21 | 159 | 75.76% |
| 2023 | $25,835,362 | $1,123,277 | $121.31 | $549.00 | 204,847 | 218,737 | 23 | 183 | 93.47% |
| 2024 | $24,615,726 | $984,629 | $113.06 | $649.00 | 217,847 | 237,326 | 25 | 199 | 92.15% |
Note: All data presented for informational purposes only. BroadwayWorld.com makes no guarantees as to the accuracy of the data, or the matter in which it's presented. Source: The Broadway League..
Videos
 |
Thumbelina: A Little Musical
Wychwood Theatre (5/4 - 6/23)
PHOTOS
VIDEOS
| |
 |
The Rear Window
Hart House Theatre (5/15 - 5/31) | |

|
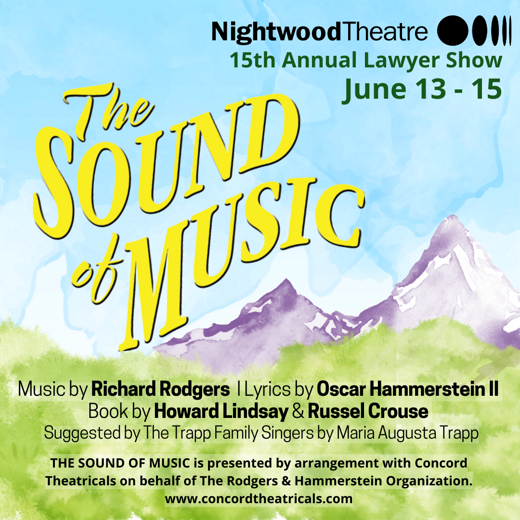
Nightwood Theatre's 2024 Lawyer Show: The Sound of Music
The St. Lawrence Centre for the Arts (6/13 - 6/15) | |

|
A Year with Frog and Toad
Capitol Theatre Port Hope (5/17 - 6/2) | |

|
Harbourfront Centre Celebrates 50 Years of Arts, Culture and Unity with an Exciting Summer Lineup of Anniversary Events and Long Weekend Festivals
Harbourfront Centre (6/1 - 8/28) | |

|
Elephant and Piggie's We are in a Play!
Randolph Theatre (6/15 - 7/7)
PHOTOS
VIDEOS
| |

|
Swipes Right: Back on the Apps
The Second City (1/8 - 6/29) | |

|
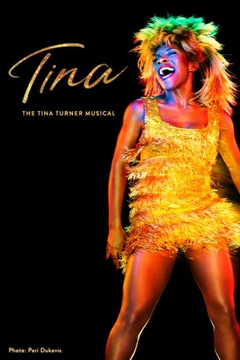
Tina: The Tina Turner Musical
Ed Mirvish Theatre (6/18 - 7/28) | |

|
SPIN - in concert
Guild Festival Theatre (7/6 - 7/6) | |
| VIEW SHOWS ADD A SHOW | ||
Recommended For You


