Jump to Week:
1 |
2 |
3 |
4 |
5 |
6 |
7 |
8 |
9 |
10 |
11 |
12 |
13 |
14 |
15 |
16 |
17 |
18 |
19 |
20 |
21 |
22 |
23 |
24 |
25 |
26 |
27 |
28 |
29 |
30 |
31 |
32 |
33 |
34 |
35 |
36 |
37 |
38 |
39 |
40 |
41 |
42 |
43 |
44 |
45 |
46 |
47 |
48 |
49 |
50 |
51 |
52
Note: All data presented for informational purposes only. BroadwayWorld.com makes no guarantees as to the accuracy of the data, or the matter in which it's presented. Source: The Broadway League..
| YEAR | Total Gross | Avg. Gross | Average Ticket | Top Ticket | Seats Sold |
Total Seats |
Shows | Perf. | Average % |
| 1996 | $10,492,980 | $388,629 | $43.45 | $75.00 | 225,701 | 112,836 | 27 | 210 | 36.72% |
| 1997 | $11,003,450 | $354,950 | $45.23 | $75.00 | 232,528 | 297,831 | 31 | 240 | 76.95% |
| 1998 | $12,143,933 | $367,998 | $46.01 | $75.00 | 249,563 | 326,868 | 33 | 260 | 76.09% |
| 1999 | $12,490,136 | $378,489 | $47.55 | $100.00 | 249,171 | 322,827 | 33 | 261 | 76.96% |
| 2000 | $14,229,630 | $406,561 | $52.53 | $90.00 | 262,858 | 349,376 | 35 | 277 | 75.13% |
| 2001 | $13,898,390 | $434,325 | $53.36 | $100.00 | 249,677 | 316,968 | 32 | 254 | 77.21% |
| 2002 | $14,521,726 | $453,804 | $57.23 | $480.00 | 240,044 | 302,937 | 32 | 245 | 78.94% |
| 2003 | $15,138,342 | $473,073 | $58.42 | $480.00 | 239,396 | 305,925 | 32 | 247 | 77.07% |
| 2004 | $15,225,577 | $507,519 | $61.35 | $480.00 | 236,295 | 305,536 | 30 | 240 | 75.90% |
| 2005 | $17,709,679 | $491,936 | $64.62 | $240.00 | 261,896 | 340,063 | 36 | 277 | 76.02% |
| 2006 | $19,493,930 | $526,863 | $67.87 | $301.25 | 272,599 | 360,804 | 37 | 297 | 74.80% |
| 2007 | $20,736,200 | $592,463 | $70.48 | $351.50 | 281,035 | 347,818 | 35 | 279 | 79.85% |
| 2008 | $20,332,995 | $580,943 | $70.90 | $351.50 | 276,741 | 334,888 | 35 | 280 | 81.74% |
| 2009 | $19,514,195 | $573,947 | $70.17 | $350.00 | 260,753 | 328,648 | 34 | 272 | 77.21% |
| 2010 | $22,465,357 | $680,768 | $80.91 | $350.00 | 264,140 | 325,984 | 33 | 264 | 79.51% |
| 2011 | $23,029,213 | $639,700 | $79.01 | $350.00 | 279,247 | 346,766 | 36 | 283 | 79.77% |
| 2012 | $25,244,974 | $664,341 | $84.63 | $477.00 | 280,012 | 368,885 | 38 | 300 | 75.83% |
| 2013 | $24,657,288 | $880,617 | $99.52 | $477.00 | 240,992 | 271,819 | 28 | 221 | 88.55% |
| 2014 | $30,013,859 | $833,718 | $98.45 | $477.00 | 296,277 | 336,323 | 36 | 284 | 87.96% |
| 2015 | $28,102,520 | $851,592 | $99.28 | $497.00 | 276,445 | 317,420 | 33 | 262 | 87.13% |
| 2016 | $26,269,816 | $729,717 | $93.78 | $477.00 | 268,762 | 342,524 | 36 | 282 | 79.27% |
| 2017 | $33,603,538 | $933,432 | $107.85 | $849.00 | 297,007 | 345,915 | 36 | 286 | 86.40% |
| 2018 | $38,813,254 | $1,108,950 | $128.04 | $850.00 | 311,582 | 335,852 | 35 | 274 | 92.95% |
| 2019 | $35,092,350 | $948,442 | $108.39 | $849.00 | 310,574 | 344,665 | 37 | 293 | 90.10% |
| 2021 | $18,664,763 | $888,798 | $114.97 | $449.00 | 139,148 | 155,294 | 21 | 132 | 86.04% |
| 2022 | $30,349,653 | $867,133 | $113.29 | $597.00 | 246,003 | 308,288 | 35 | 271 | 79.19% |
| 2023 | $31,275,852 | $893,596 | $113.99 | $549.00 | 264,947 | 312,004 | 35 | 271 | 84.49% |
Note: All data presented for informational purposes only. BroadwayWorld.com makes no guarantees as to the accuracy of the data, or the matter in which it's presented. Source: The Broadway League..
Videos
 |
Thumbelina: A Little Musical
Wychwood Theatre (5/4 - 6/23)
PHOTOS
VIDEOS
| |
 |
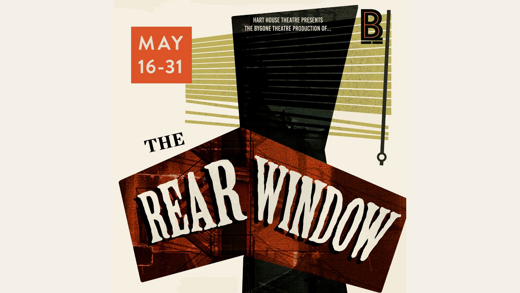
The Rear Window
Hart House Theatre (5/15 - 5/31) | |

|
Hadestown
Ed Mirvish Theatre (5/15 - 5/26) | |

|
FREEDOM! A Tribute to Aretha Franklin
Toronto Symphony Orchestra (5/21 - 5/22) | |

|
A Goat, A Ghost and A Guinness
The Al Green Theatre (5/16 - 5/19) | |

|
Shrek the Musical (Non-Equity)
Princess of Wales Theatre (8/6 - 8/18) | |

|
The Glory of Living: A play by Rebecca Gilman
The King Black Box (5/16 - 5/31) | |

|
Harbourfront Centre Celebrates 50 Years of Arts, Culture and Unity with an Exciting Summer Lineup of Anniversary Events and Long Weekend Festivals
Harbourfront Centre (6/1 - 8/28) | |

|
The Rocky Horror Show
Scarborough Village Theatre (5/9 - 5/25) | |
| VIEW SHOWS ADD A SHOW | ||
Recommended For You


