Jump to Week:
1 |
2 |
3 |
4 |
5 |
6 |
7 |
8 |
9 |
10 |
11 |
12 |
13 |
14 |
15 |
16 |
17 |
18 |
19 |
20 |
21 |
22 |
23 |
24 |
25 |
26 |
27 |
28 |
29 |
30 |
31 |
32 |
33 |
34 |
35 |
36 |
37 |
38 |
39 |
40 |
41 |
42 |
43 |
44 |
45 |
46 |
47 |
48 |
49 |
50 |
51 |
52
Note: All data presented for informational purposes only. BroadwayWorld.com makes no guarantees as to the accuracy of the data, or the matter in which it's presented. Source: The Broadway League..
| YEAR | Total Gross | Avg. Gross | Average Ticket | Top Ticket | Seats Sold |
Total Seats |
Shows | Perf. | Average % |
| 1996 | $8,202,848 | $328,114 | $43.03 | $75.00 | 175,690 | 231,647 | 25 | 185 | 76.85% |
| 1997 | $9,639,981 | $357,036 | $46.11 | $75.00 | 200,608 | 260,975 | 27 | 206 | 77.32% |
| 1998 | $9,480,444 | $338,587 | $46.14 | $80.00 | 198,794 | 269,499 | 28 | 211 | 70.76% |
| 1999 | $9,338,193 | $333,507 | $47.44 | $90.00 | 181,855 | 255,892 | 28 | 203 | 69.11% |
| 2000 | $11,632,731 | $430,842 | $53.56 | $90.00 | 211,111 | 271,046 | 27 | 210 | 78.66% |
| 2001 | $10,291,692 | $381,174 | $51.44 | $100.00 | 189,345 | 255,900 | 27 | 209 | 74.34% |
| 2002 | $13,222,116 | $455,935 | $58.96 | $480.00 | 208,310 | 289,248 | 29 | 229 | 69.32% |
| 2003 | $13,759,810 | $443,865 | $61.04 | $480.00 | 212,506 | 292,088 | 31 | 240 | 70.38% |
| 2004 | $11,102,212 | $427,008 | $57.84 | $251.25 | 176,761 | 252,426 | 26 | 200 | 67.51% |
| 2005 | $15,191,031 | $523,829 | $64.68 | $301.25 | 220,398 | 269,599 | 29 | 217 | 79.16% |
| 2006 | $17,719,211 | $590,640 | $70.31 | $301.25 | 239,080 | 292,885 | 30 | 235 | 80.59% |
| 2007 | $16,754,159 | $507,702 | $67.18 | $351.50 | 236,084 | 313,423 | 33 | 253 | 74.50% |
| 2008 | $15,656,658 | $521,889 | $71.96 | $350.00 | 203,504 | 286,288 | 30 | 236 | 69.94% |
| 2009 | $18,302,315 | $571,947 | $73.25 | $375.00 | 229,603 | 311,186 | 32 | 255 | 73.01% |
| 2010 | $19,695,426 | $547,095 | $76.43 | $350.00 | 244,093 | 342,624 | 36 | 287 | 70.57% |
| 2011 | $21,228,862 | $758,174 | $88.43 | $475.00 | 229,544 | 276,604 | 28 | 219 | 83.95% |
| 2012 | $20,083,786 | $692,544 | $88.90 | $477.00 | 214,909 | 269,827 | 29 | 218 | 79.48% |
| 2013 | $22,476,713 | $725,055 | $91.41 | $477.00 | 230,404 | 283,911 | 31 | 243 | 80.59% |
| 2014 | $23,464,674 | $690,137 | $95.19 | $477.00 | 239,269 | 315,283 | 34 | 264 | 77.09% |
| 2015 | $22,819,831 | $691,510 | $89.89 | $477.00 | 240,104 | 306,864 | 33 | 260 | 77.53% |
| 2016 | $25,194,008 | $812,710 | $100.21 | $549.00 | 242,811 | 298,970 | 31 | 237 | 82.36% |
| 2017 | $28,628,694 | $1,022,453 | $123.63 | $850.00 | 231,168 | 262,657 | 28 | 216 | 88.31% |
| 2018 | $33,078,712 | $894,019 | $114.28 | $850.00 | 279,469 | 324,387 | 37 | 279 | 85.95% |
| 2019 | $31,122,601 | $915,371 | $111.45 | $847.00 | 270,173 | 308,302 | 34 | 261 | 86.33% |
| 2022 | $27,346,822 | $882,156 | $109.87 | $599.00 | 228,593 | 270,186 | 31 | 234 | 83.49% |
| 2023 | $26,480,578 | $945,735 | $116.40 | $599.00 | 218,581 | 252,632 | 28 | 219 | 84.99% |
Note: All data presented for informational purposes only. BroadwayWorld.com makes no guarantees as to the accuracy of the data, or the matter in which it's presented. Source: The Broadway League..
Videos
 |
Thumbelina: A Little Musical
Wychwood Theatre (5/4 - 6/23)
PHOTOS
VIDEOS
| |
 |
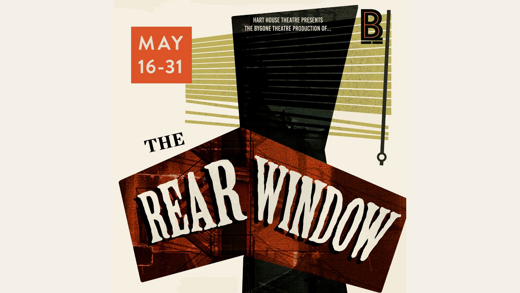
The Rear Window
Hart House Theatre (5/15 - 5/31) | |

|
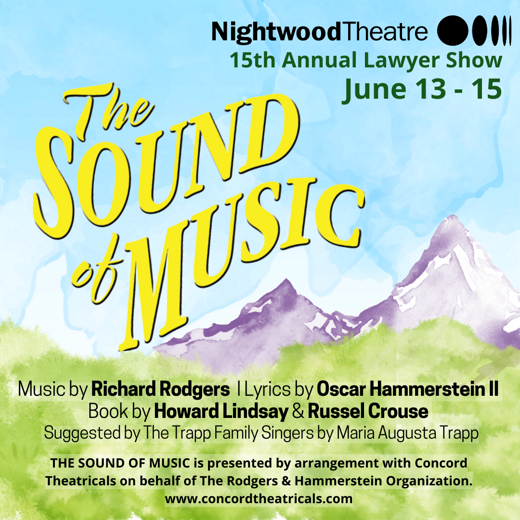
Nightwood Theatre's 2024 Lawyer Show: The Sound of Music
The St. Lawrence Centre for the Arts (6/13 - 6/15) | |

|
A Year with Frog and Toad
Capitol Theatre Port Hope (5/17 - 6/2) | |

|
Harbourfront Centre Celebrates 50 Years of Arts, Culture and Unity with an Exciting Summer Lineup of Anniversary Events and Long Weekend Festivals
Harbourfront Centre (6/1 - 8/28) | |

|
Elephant and Piggie's We are in a Play!
Randolph Theatre (6/15 - 7/7)
PHOTOS
VIDEOS
| |

|
Swipes Right: Back on the Apps
The Second City (1/8 - 6/29) | |

|
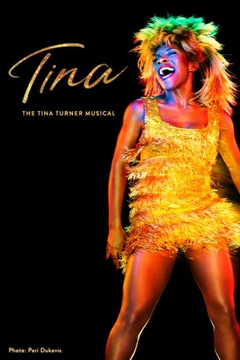
Tina: The Tina Turner Musical
Ed Mirvish Theatre (6/18 - 7/28) | |

|
SPIN - in concert
Guild Festival Theatre (7/6 - 7/6) | |
| VIEW SHOWS ADD A SHOW | ||
Recommended For You


