Jump to Week:
1 |
2 |
3 |
4 |
5 |
6 |
7 |
8 |
9 |
10 |
11 |
12 |
13 |
14 |
15 |
16 |
17 |
18 |
19 |
20 |
21 |
22 |
23 |
24 |
25 |
26 |
27 |
28 |
29 |
30 |
31 |
32 |
33 |
34 |
35 |
36 |
37 |
38 |
39 |
40 |
41 |
42 |
43 |
44 |
45 |
46 |
47 |
48 |
49 |
50 |
51 |
52
Note: All data presented for informational purposes only. BroadwayWorld.com makes no guarantees as to the accuracy of the data, or the matter in which it's presented. Source: The Broadway League..
| YEAR | Total Gross | Avg. Gross | Average Ticket | Top Ticket | Seats Sold |
Total Seats |
Shows | Perf. | Average % |
| 1996 | $7,005,611 | $333,601 | $46.50 | $104.68 | 142,775 | 209,627 | 21 | 161 | 69.85% |
| 1997 | $6,573,927 | $345,996 | $48.91 | $75.00 | 130,887 | 190,182 | 19 | 151 | 70.46% |
| 1998 | $8,205,498 | $410,275 | $51.30 | $75.00 | 156,365 | 204,946 | 20 | 158 | 76.66% |
| 1999 | $8,326,196 | $438,221 | $50.58 | $90.00 | 158,337 | 203,184 | 19 | 152 | 77.45% |
| 2000 | $11,793,441 | $512,758 | $55.43 | $90.00 | 210,157 | 255,768 | 23 | 184 | 83.00% |
| 2001 | $9,116,437 | $414,384 | $53.05 | $100.00 | 160,081 | 221,096 | 22 | 176 | 71.60% |
| 2002 | $9,087,140 | $395,093 | $56.96 | $480.00 | 146,518 | 234,352 | 23 | 184 | 61.13% |
| 2003 | $8,966,967 | $471,946 | $61.05 | $480.00 | 140,106 | 198,896 | 19 | 152 | 71.17% |
| 2004 | $10,919,377 | $496,335 | $62.53 | $251.25 | 163,977 | 236,174 | 22 | 174 | 67.23% |
| 2005 | $13,360,243 | $580,880 | $67.87 | $301.25 | 190,627 | 243,704 | 23 | 184 | 78.04% |
| 2006 | $16,316,341 | $709,406 | $75.35 | $301.25 | 209,388 | 237,286 | 23 | 183 | 87.27% |
| 2007 | $12,482,904 | $594,424 | $75.67 | $351.50 | 158,183 | 220,656 | 21 | 168 | 71.19% |
| 2008 | $13,119,538 | $524,782 | $73.60 | $350.00 | 171,144 | 248,496 | 25 | 194 | 69.50% |
| 2009 | $15,811,626 | $832,191 | $87.70 | $350.00 | 176,361 | 201,280 | 19 | 152 | 87.98% |
| 2010 | $16,669,049 | $757,684 | $84.32 | $350.00 | 189,021 | 237,484 | 22 | 173 | 80.04% |
| 2011 | $18,454,882 | $802,386 | $88.72 | $477.00 | 201,396 | 257,256 | 23 | 184 | 79.77% |
| 2012 | $19,275,243 | $876,147 | $98.38 | $477.00 | 190,433 | 227,096 | 22 | 176 | 84.57% |
| 2013 | $18,374,971 | $765,624 | $90.35 | $477.00 | 190,578 | 231,770 | 24 | 184 | 81.90% |
| 2014 | $19,843,322 | $826,805 | $96.02 | $477.00 | 203,128 | 239,032 | 24 | 192 | 84.82% |
| 2015 | $22,236,019 | $926,501 | $103.28 | $477.00 | 208,797 | 249,937 | 24 | 191 | 83.29% |
| 2016 | $23,234,261 | $893,625 | $99.59 | $477.00 | 224,722 | 272,064 | 26 | 203 | 83.18% |
| 2017 | $27,899,476 | $996,410 | $109.96 | $849.00 | 237,871 | 271,952 | 28 | 223 | 87.00% |
| 2018 | $29,524,979 | $952,419 | $116.94 | $850.00 | 249,078 | 292,458 | 31 | 241 | 84.74% |
| 2019 | $25,965,471 | $1,038,619 | $111.34 | $849.00 | 224,402 | 244,208 | 25 | 190 | 91.74% |
| 2022 | $25,329,740 | $1,206,178 | $125.62 | $597.00 | 194,473 | 216,476 | 21 | 166 | 89.67% |
| 2023 | $26,027,346 | $1,131,624 | $121.59 | $799.00 | 209,122 | 228,998 | 23 | 183 | 90.88% |
Note: All data presented for informational purposes only. BroadwayWorld.com makes no guarantees as to the accuracy of the data, or the matter in which it's presented. Source: The Broadway League..
Videos
 |
Thumbelina: A Little Musical
Wychwood Theatre (5/4 - 6/23)
PHOTOS
VIDEOS
| |
 |
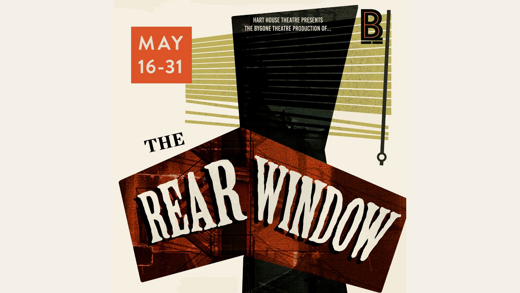
The Rear Window
Hart House Theatre (5/15 - 5/31) | |

|
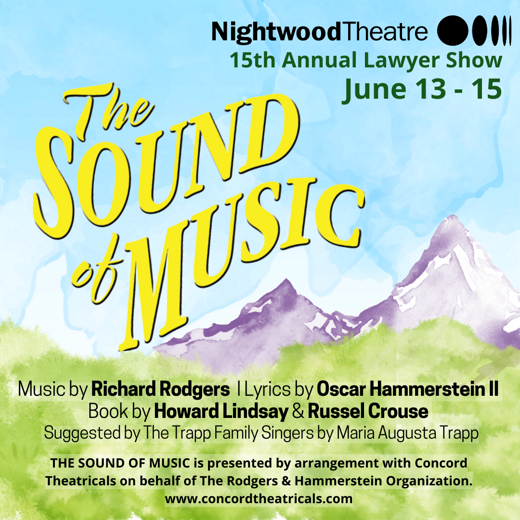
Nightwood Theatre's 2024 Lawyer Show: The Sound of Music
The St. Lawrence Centre for the Arts (6/13 - 6/15) | |

|
A Year with Frog and Toad
Capitol Theatre Port Hope (5/17 - 6/2) | |

|
Harbourfront Centre Celebrates 50 Years of Arts, Culture and Unity with an Exciting Summer Lineup of Anniversary Events and Long Weekend Festivals
Harbourfront Centre (6/1 - 8/28) | |

|
Elephant and Piggie's We are in a Play!
Randolph Theatre (6/15 - 7/7)
PHOTOS
VIDEOS
| |

|
Swipes Right: Back on the Apps
The Second City (1/8 - 6/29) | |

|
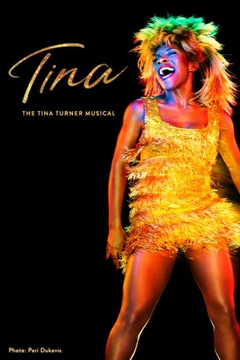
Tina: The Tina Turner Musical
Ed Mirvish Theatre (6/18 - 7/28) | |

|
SPIN - in concert
Guild Festival Theatre (7/6 - 7/6) | |
| VIEW SHOWS ADD A SHOW | ||
Recommended For You


