Jump to Week:
1 |
2 |
3 |
4 |
5 |
6 |
7 |
8 |
9 |
10 |
11 |
12 |
13 |
14 |
15 |
16 |
17 |
18 |
19 |
20 |
21 |
22 |
23 |
24 |
25 |
26 |
27 |
28 |
29 |
30 |
31 |
32 |
33 |
34 |
35 |
36 |
37 |
38 |
39 |
40 |
41 |
42 |
43 |
44 |
45 |
46 |
47 |
48 |
49 |
50 |
51 |
52
Note: All data presented for informational purposes only. BroadwayWorld.com makes no guarantees as to the accuracy of the data, or the matter in which it's presented. Source: The Broadway League..
| YEAR | Total Gross | Avg. Gross | Average Ticket | Top Ticket | Seats Sold |
Total Seats |
Shows | Perf. | Average % |
| 1996 | $5,890,597 | $346,506 | $40.57 | $75.00 | 137,732 | 44,822 | 17 | 132 | 24.73% |
| 1997 | $7,530,854 | $342,312 | $42.55 | $75.00 | 169,038 | 201,049 | 22 | 166 | 84.20% |
| 1998 | $10,691,521 | $381,840 | $45.47 | $75.00 | 225,838 | 280,093 | 28 | 223 | 79.91% |
| 1999 | $9,964,982 | $355,892 | $45.89 | $85.00 | 206,903 | 270,489 | 28 | 218 | 73.69% |
| 2000 | $10,144,502 | $390,173 | $52.00 | $90.00 | 190,267 | 252,078 | 26 | 197 | 75.94% |
| 2001 | $10,540,457 | $405,402 | $51.44 | $90.00 | 197,850 | 248,988 | 26 | 203 | 79.43% |
| 2002 | $12,648,421 | $451,729 | $56.15 | $480.00 | 210,289 | 250,606 | 28 | 206 | 81.43% |
| 2003 | $5,237,855 | $193,995 | $51.49 | $480.00 | 97,026 | 157,697 | 27 | 132 | 63.93% |
| 2004 | $12,955,346 | $518,214 | $60.89 | $480.00 | 200,168 | 258,843 | 25 | 197 | 76.10% |
| 2005 | $12,306,040 | $512,752 | $62.85 | $240.00 | 188,766 | 248,067 | 24 | 189 | 75.19% |
| 2006 | $13,820,072 | $575,836 | $69.97 | $301.25 | 190,793 | 233,448 | 24 | 192 | 81.41% |
| 2007 | $18,114,083 | $566,065 | $68.94 | $351.50 | 251,847 | 315,021 | 32 | 253 | 79.02% |
| 2008 | $16,184,132 | $505,754 | $66.38 | $351.50 | 233,290 | 309,901 | 32 | 255 | 74.41% |
| 2009 | $14,270,631 | $548,870 | $71.34 | $350.00 | 190,532 | 250,149 | 26 | 199 | 75.26% |
| 2010 | $15,227,616 | $543,843 | $71.67 | $350.00 | 201,540 | 265,469 | 28 | 223 | 75.98% |
| 2011 | $15,042,072 | $578,541 | $75.43 | $350.00 | 191,523 | 256,707 | 26 | 202 | 74.28% |
| 2012 | $16,890,525 | $625,575 | $83.85 | $477.00 | 192,998 | 254,590 | 27 | 209 | 76.97% |
| 2013 | $18,085,585 | $786,330 | $88.52 | $477.00 | 196,604 | 231,573 | 23 | 179 | 85.37% |
| 2014 | $21,278,718 | $759,954 | $94.46 | $477.00 | 223,002 | 263,268 | 28 | 213 | 84.74% |
| 2015 | $18,260,267 | $730,411 | $95.05 | $475.00 | 188,591 | 241,934 | 25 | 199 | 78.90% |
| 2016 | $20,679,975 | $646,249 | $85.26 | $477.00 | 230,558 | 307,828 | 32 | 253 | 75.81% |
| 2017 | $23,822,900 | $850,818 | $100.94 | $849.00 | 226,218 | 263,025 | 28 | 213 | 87.01% |
| 2018 | $29,425,486 | $1,014,672 | $123.48 | $850.00 | 243,913 | 276,029 | 29 | 224 | 88.49% |
| 2019 | $30,252,790 | $975,896 | $107.34 | $849.00 | 271,052 | 302,029 | 31 | 245 | 89.95% |
| 2020 | $26,700,956 | $890,032 | $104.58 | $847.00 | 253,453 | 284,888 | 30 | 226 | 89.68% |
| 2022 | $19,746,607 | $1,039,295 | $124.00 | $697.00 | 153,269 | 196,055 | 19 | 149 | 78.22% |
| 2023 | $25,163,054 | $1,048,461 | $120.36 | $549.00 | 202,944 | 229,942 | 24 | 184 | 87.75% |
| 2024 | $24,545,774 | $1,022,741 | $120.48 | $649.00 | 204,915 | 225,216 | 24 | 183 | 91.15% |
Note: All data presented for informational purposes only. BroadwayWorld.com makes no guarantees as to the accuracy of the data, or the matter in which it's presented. Source: The Broadway League..
Videos
 |
Thumbelina: A Little Musical
Wychwood Theatre (5/4 - 6/23)
PHOTOS
VIDEOS
| |
 |
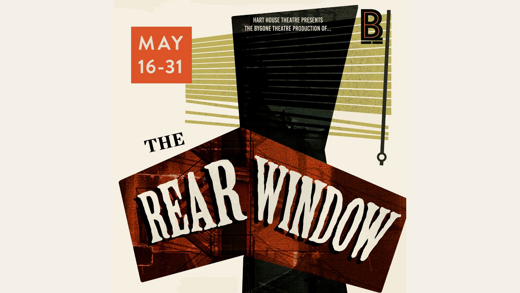
The Rear Window
Hart House Theatre (5/15 - 5/31) | |

|
Hadestown
Ed Mirvish Theatre (5/15 - 5/26) | |

|
FREEDOM! A Tribute to Aretha Franklin
Toronto Symphony Orchestra (5/21 - 5/22) | |

|
A Goat, A Ghost and A Guinness
The Al Green Theatre (5/16 - 5/19) | |

|
Shrek the Musical (Non-Equity)
Princess of Wales Theatre (8/6 - 8/18) | |

|
The Glory of Living: A play by Rebecca Gilman
The King Black Box (5/16 - 5/31) | |

|
Harbourfront Centre Celebrates 50 Years of Arts, Culture and Unity with an Exciting Summer Lineup of Anniversary Events and Long Weekend Festivals
Harbourfront Centre (6/1 - 8/28) | |

|
The Rocky Horror Show
Scarborough Village Theatre (5/9 - 5/25) | |
| VIEW SHOWS ADD A SHOW | ||
Recommended For You


