Jump to Week:
1 |
2 |
3 |
4 |
5 |
6 |
7 |
8 |
9 |
10 |
11 |
12 |
13 |
14 |
15 |
16 |
17 |
18 |
19 |
20 |
21 |
22 |
23 |
24 |
25 |
26 |
27 |
28 |
29 |
30 |
31 |
32 |
33 |
34 |
35 |
36 |
37 |
38 |
39 |
40 |
41 |
42 |
43 |
44 |
45 |
46 |
47 |
48 |
49 |
50 |
51 |
52
Note: All data presented for informational purposes only. BroadwayWorld.com makes no guarantees as to the accuracy of the data, or the matter in which it's presented. Source: The Broadway League..
| YEAR | Total Gross | Avg. Gross | Average Ticket | Top Ticket | Seats Sold |
Total Seats |
Shows | Perf. | Average % |
| 1996 | $8,756,777 | $398,035 | $45.80 | $75.00 | 183,755 | 215,387 | 22 | 170 | 84.45% |
| 1997 | $9,076,788 | $432,228 | $49.16 | $75.00 | 180,291 | 201,550 | 21 | 163 | 89.45% |
| 1998 | $9,435,460 | $410,237 | $49.27 | $75.00 | 184,746 | 236,762 | 23 | 182 | 78.56% |
| 1999 | $9,318,176 | $443,723 | $49.45 | $90.00 | 181,396 | 227,504 | 21 | 168 | 78.67% |
| 2000 | $11,940,163 | $519,138 | $55.19 | $90.00 | 214,249 | 255,768 | 23 | 184 | 84.30% |
| 2001 | $11,049,822 | $460,409 | $54.33 | $100.00 | 192,327 | 242,056 | 24 | 192 | 78.19% |
| 2002 | $13,632,191 | $504,896 | $58.21 | $480.00 | 221,682 | 267,066 | 27 | 215 | 81.77% |
| 2003 | $13,020,576 | $591,844 | $64.96 | $480.00 | 193,138 | 222,699 | 22 | 172 | 86.63% |
| 2004 | $12,179,115 | $487,165 | $61.22 | $251.25 | 183,641 | 258,208 | 25 | 193 | 69.21% |
| 2005 | $13,994,413 | $583,101 | $67.78 | $301.25 | 199,770 | 251,742 | 24 | 191 | 79.28% |
| 2006 | $15,411,367 | $670,059 | $73.90 | $301.25 | 199,256 | 237,286 | 23 | 183 | 82.71% |
| 2007 | $16,323,215 | $777,296 | $79.24 | $351.50 | 201,235 | 220,656 | 21 | 168 | 91.23% |
| 2008 | $17,160,611 | $715,025 | $79.10 | $350.00 | 209,039 | 237,112 | 24 | 186 | 87.50% |
| 2009 | $16,940,468 | $847,023 | $88.83 | $350.00 | 184,326 | 213,432 | 20 | 160 | 86.35% |
| 2010 | $16,139,305 | $768,538 | $84.97 | $350.00 | 183,587 | 233,784 | 21 | 168 | 78.53% |
| 2011 | $11,622,882 | $505,343 | $85.45 | $477.00 | 130,853 | 165,733 | 23 | 118 | 80.11% |
| 2012 | $19,302,941 | $839,258 | $94.96 | $477.00 | 196,997 | 241,136 | 23 | 184 | 82.37% |
| 2013 | $20,496,643 | $891,158 | $96.80 | $477.00 | 199,212 | 240,170 | 23 | 182 | 83.71% |
| 2014 | $22,905,607 | $916,224 | $105.10 | $477.00 | 215,232 | 239,592 | 25 | 195 | 90.35% |
| 2015 | $21,736,748 | $905,698 | $101.54 | $477.00 | 206,895 | 249,937 | 24 | 191 | 82.43% |
| 2016 | $21,495,767 | $859,831 | $98.25 | $477.00 | 209,834 | 261,593 | 25 | 196 | 80.68% |
| 2017 | $26,578,507 | $916,500 | $104.90 | $849.00 | 232,301 | 278,832 | 29 | 232 | 82.78% |
| 2018 | $32,089,528 | $1,069,651 | $126.93 | $850.00 | 250,180 | 284,704 | 30 | 231 | 87.90% |
| 2019 | $28,652,877 | $1,245,777 | $124.69 | $849.00 | 227,568 | 237,992 | 23 | 184 | 96.06% |
| 2022 | $23,513,592 | $1,119,695 | $121.02 | $597.00 | 186,077 | 217,388 | 21 | 167 | 85.47% |
| 2023 | $27,215,118 | $1,088,605 | $121.16 | $549.00 | 214,332 | 249,386 | 25 | 203 | 85.96% |
Note: All data presented for informational purposes only. BroadwayWorld.com makes no guarantees as to the accuracy of the data, or the matter in which it's presented. Source: The Broadway League..
Videos
 |
Thumbelina: A Little Musical
Wychwood Theatre (5/4 - 6/23)
PHOTOS
VIDEOS
| |
 |
Broadway Blockbusters with Ramin Karimloo & Mikaela Bennett
Toronto Symphony Orchestra (6/25 - 6/26) | |

|
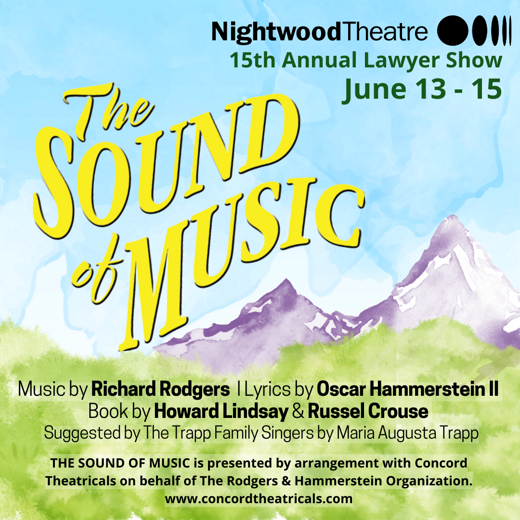
Nightwood Theatre's 2024 Lawyer Show: The Sound of Music
The St. Lawrence Centre for the Arts (6/13 - 6/15) | |

|
Shrek the Musical (Non-Equity)
Princess of Wales Theatre (8/6 - 8/18) | |

|
SPIN - in concert
Guild Festival Theatre (7/6 - 7/6) | |

|
The Monkey Show
Wychwood Theatre (6/4 - 6/5) | |

|
Wicked
Princess of Wales Theatre (6/5 - 7/21) | |

|
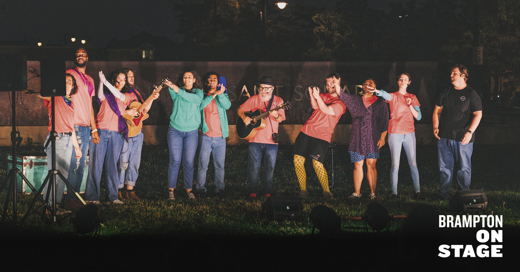
Brampton's Own Shakespeare Show: Taming of the Shrew
Brampton On Stage (7/18 - 8/3) | |

|
Harbourfront Centre Celebrates 50 Years of Arts, Culture and Unity with an Exciting Summer Lineup of Anniversary Events and Long Weekend Festivals
Harbourfront Centre (6/1 - 8/28) | |
| VIEW SHOWS ADD A SHOW | ||
Recommended For You

