Jump to Week:
1 |
2 |
3 |
4 |
5 |
6 |
7 |
8 |
9 |
10 |
11 |
12 |
13 |
14 |
15 |
16 |
17 |
18 |
19 |
20 |
21 |
22 |
23 |
24 |
25 |
26 |
27 |
28 |
29 |
30 |
31 |
32 |
33 |
34 |
35 |
36 |
37 |
38 |
39 |
40 |
41 |
42 |
43 |
44 |
45 |
46 |
47 |
48 |
49 |
50 |
51 |
52
Note: All data presented for informational purposes only. BroadwayWorld.com makes no guarantees as to the accuracy of the data, or the matter in which it's presented. Source: The Broadway League..
| YEAR | Total Gross | Avg. Gross | Average Ticket | Top Ticket | Seats Sold |
Total Seats |
Shows | Perf. | Average % |
| 1996 | $9,039,575 | $430,456 | $46.60 | $75.00 | 185,526 | 208,194 | 21 | 159 | 88.59% |
| 1997 | $9,294,143 | $442,578 | $48.93 | $75.00 | 184,779 | 204,572 | 21 | 166 | 89.44% |
| 1998 | $10,368,692 | $471,304 | $49.58 | $75.00 | 201,551 | 234,744 | 22 | 175 | 84.93% |
| 1999 | $9,929,218 | $451,328 | $48.78 | $90.00 | 193,420 | 235,576 | 22 | 176 | 80.31% |
| 2000 | $12,692,763 | $528,865 | $55.15 | $90.00 | 227,408 | 264,280 | 24 | 192 | 86.78% |
| 2001 | $12,419,808 | $496,792 | $54.48 | $100.00 | 217,780 | 261,520 | 25 | 200 | 82.35% |
| 2002 | $13,578,668 | $484,952 | $57.58 | $480.00 | 220,891 | 267,789 | 28 | 216 | 80.71% |
| 2003 | $11,484,269 | $522,012 | $64.38 | $480.00 | 170,675 | 193,995 | 22 | 154 | 86.97% |
| 2004 | $14,519,800 | $537,770 | $62.42 | $251.25 | 217,796 | 273,024 | 27 | 209 | 78.36% |
| 2005 | $15,530,843 | $597,340 | $67.95 | $301.25 | 220,996 | 265,423 | 26 | 207 | 82.88% |
| 2006 | $16,302,904 | $679,288 | $73.42 | $301.25 | 210,385 | 241,768 | 24 | 188 | 85.05% |
| 2007 | $17,865,228 | $714,609 | $75.93 | $351.50 | 224,740 | 248,682 | 25 | 199 | 88.49% |
| 2008 | $18,623,072 | $716,272 | $77.81 | $350.00 | 230,788 | 263,408 | 26 | 208 | 86.82% |
| 2009 | $19,325,547 | $920,264 | $91.01 | $350.00 | 205,894 | 222,632 | 21 | 168 | 92.22% |
| 2010 | $19,217,416 | $800,726 | $85.89 | $350.00 | 214,889 | 258,568 | 24 | 192 | 82.30% |
| 2011 | $20,858,831 | $869,118 | $90.05 | $477.00 | 221,435 | 265,224 | 24 | 192 | 83.96% |
| 2012 | $22,096,556 | $883,862 | $98.35 | $477.00 | 218,168 | 262,684 | 25 | 200 | 82.18% |
| 2013 | $21,839,391 | $949,539 | $101.73 | $477.00 | 204,032 | 236,366 | 23 | 183 | 86.79% |
| 2014 | $25,177,910 | $1,007,116 | $107.47 | $477.00 | 230,964 | 255,175 | 25 | 200 | 90.88% |
| 2015 | $24,604,610 | $984,184 | $104.44 | $477.00 | 226,453 | 263,841 | 25 | 199 | 85.95% |
| 2016 | $24,414,936 | $939,036 | $100.94 | $477.00 | 231,726 | 280,688 | 26 | 208 | 82.66% |
| 2017 | $30,312,338 | $1,010,411 | $108.20 | $849.00 | 260,456 | 294,718 | 30 | 241 | 87.47% |
| 2018 | $35,465,012 | $1,182,167 | $131.86 | $850.00 | 264,673 | 295,012 | 30 | 237 | 89.21% |
| 2019 | $31,972,753 | $1,141,884 | $121.76 | $849.00 | 258,918 | 278,816 | 28 | 216 | 93.10% |
| 2022 | $27,561,874 | $1,198,342 | $123.65 | $597.00 | 213,234 | 240,820 | 23 | 183 | 87.77% |
| 2023 | $27,655,508 | $1,106,220 | $121.41 | $599.00 | 218,877 | 243,952 | 25 | 198 | 89.77% |
Note: All data presented for informational purposes only. BroadwayWorld.com makes no guarantees as to the accuracy of the data, or the matter in which it's presented. Source: The Broadway League..
Videos
 |
Thumbelina: A Little Musical
Wychwood Theatre (5/4 - 6/23)
PHOTOS
VIDEOS
| |
 |
Broadway Blockbusters with Ramin Karimloo & Mikaela Bennett
Toronto Symphony Orchestra (6/25 - 6/26) | |

|
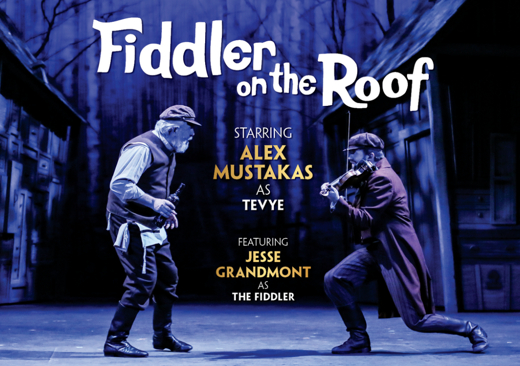
Fiddler on the Roof
Huron Country Playhouse (6/12 - 6/30) | |

|
How We Got To Jersey: A Tale of Two Frankies presented by Theatre Collingwood
The John Saunders Centre (6/11 - 6/14) | |

|
Harbourfront Centre Celebrates 50 Years of Arts, Culture and Unity with an Exciting Summer Lineup of Anniversary Events and Long Weekend Festivals
Harbourfront Centre (6/1 - 8/28) | |

|
Sondheim on Sondheim
Scarborough Music Theatre (2/6 - 2/22) | |

|
Twinkle Twinkle
Wychwood Theatre (6/29 - 7/21) | |

|
R.A.V.E.
Outside the March (6/9 - 6/16) | |

|
The Second City 89th Mainstage Revue
The Second City (4/10 - 6/5) | |
| VIEW SHOWS ADD A SHOW | ||
Recommended For You

