Jump to Week:
1 |
2 |
3 |
4 |
5 |
6 |
7 |
8 |
9 |
10 |
11 |
12 |
13 |
14 |
15 |
16 |
17 |
18 |
19 |
20 |
21 |
22 |
23 |
24 |
25 |
26 |
27 |
28 |
29 |
30 |
31 |
32 |
33 |
34 |
35 |
36 |
37 |
38 |
39 |
40 |
41 |
42 |
43 |
44 |
45 |
46 |
47 |
48 |
49 |
50 |
51 |
52
Note: All data presented for informational purposes only. BroadwayWorld.com makes no guarantees as to the accuracy of the data, or the matter in which it's presented. Source: The Broadway League..
Total Seats
| YEAR | Total Gross | Avg. Gross | Average Ticket | Top Ticket | Seats Sold |
Total Seats |
Shows | Perf. | Average % |
| 1996 | $8,551,616 | $388,710 | $43.47 | $75.00 | 181,683 | 71,748 | 22 | 171 | 25.60% |
| 1997 | $10,597,628 | $341,859 | $41.99 | $75.00 | 232,303 | 279,907 | 31 | 236 | 79.76% |
| 1998 | $11,239,179 | $340,581 | $44.18 | $75.00 | 237,285 | 309,770 | 33 | 252 | 75.29% |
| 1999 | $12,817,460 | $400,546 | $49.08 | $100.00 | 244,482 | 295,161 | 32 | 238 | 79.62% |
| 2000 | $14,061,637 | $426,110 | $51.05 | $90.00 | 269,243 | 324,303 | 33 | 252 | 81.25% |
| 2001 | $12,711,948 | $385,211 | $51.20 | $91.00 | 235,707 | 316,163 | 33 | 253 | 72.27% |
| 2002 | $14,657,129 | $458,035 | $56.30 | $480.00 | 238,643 | 292,962 | 32 | 244 | 78.08% |
| 2003 | $11,852,038 | $395,068 | $55.97 | $480.00 | 191,608 | 283,053 | 30 | 229 | 67.28% |
| 2004 | $15,195,053 | $506,502 | $61.09 | $480.00 | 232,751 | 295,178 | 30 | 231 | 77.00% |
| 2005 | $18,518,814 | $561,176 | $64.94 | $240.00 | 271,750 | 320,839 | 33 | 257 | 81.98% |
| 2006 | $18,303,578 | $571,987 | $68.87 | $301.25 | 252,013 | 295,449 | 32 | 245 | 84.36% |
| 2007 | $22,927,788 | $694,781 | $73.95 | $351.50 | 297,196 | 332,292 | 33 | 261 | 88.03% |
| 2008 | $17,974,604 | $579,826 | $70.92 | $351.50 | 244,100 | 306,632 | 31 | 241 | 78.15% |
| 2009 | $16,940,158 | $564,672 | $69.05 | $350.00 | 227,365 | 289,180 | 30 | 234 | 76.39% |
| 2010 | $24,454,025 | $741,031 | $79.80 | $350.00 | 286,351 | 324,264 | 33 | 262 | 86.55% |
| 2011 | $22,130,175 | $582,373 | $73.60 | $350.00 | 280,794 | 352,715 | 38 | 283 | 77.94% |
| 2012 | $23,815,597 | $700,459 | $84.70 | $477.00 | 262,118 | 317,027 | 34 | 254 | 82.32% |
| 2013 | $25,899,689 | $809,365 | $94.69 | $477.00 | 255,957 | 292,548 | 32 | 238 | 86.06% |
| 2014 | $26,873,434 | $746,484 | $91.20 | $477.00 | 279,366 | 333,235 | 36 | 282 | 82.81% |
| 2015 | $29,551,642 | $820,879 | $91.82 | $497.00 | 294,345 | 341,228 | 36 | 281 | 85.38% |
| 2016 | $29,929,440 | $831,373 | $98.56 | $477.00 | 285,833 | 327,066 | 36 | 265 | 87.36% |
| 2017 | $34,447,050 | $906,501 | $103.38 | $849.00 | 311,207 | 349,244 | 38 | 287 | 88.97% |
| 2018 | $42,596,197 | $1,183,228 | $130.71 | $850.00 | 327,949 | 344,450 | 36 | 278 | 95.13% |
| 2019 | $35,291,616 | $928,727 | $106.64 | $849.00 | 315,320 | 348,654 | 38 | 294 | 90.56% |
| 2021 | $182,681 | $182,681 | $34.53 | $199.00 | 5,291 | 10,200 | 1 | 8 | 51.90% |
| 2022 | $28,818,836 | $929,640 | $117.05 | $749.00 | 224,053 | 264,191 | 31 | 218 | 84.03% |
| 2023 | $34,410,203 | $1,110,007 | $118.95 | $697.00 | 270,934 | 294,843 | 31 | 246 | 91.03% |
| 2024 | $39,445,823 | $1,066,103 | $123.93 | $649.00 | 305,211 | 325,496 | 37 | 275 | 93.74% |
Note: All data presented for informational purposes only. BroadwayWorld.com makes no guarantees as to the accuracy of the data, or the matter in which it's presented. Source: The Broadway League..
Videos
 |
Thumbelina: A Little Musical
Wychwood Theatre (5/4 - 6/23)
PHOTOS
VIDEOS
| |
 |
Broadway Blockbusters with Ramin Karimloo & Mikaela Bennett
Toronto Symphony Orchestra (6/25 - 6/26) | |

|
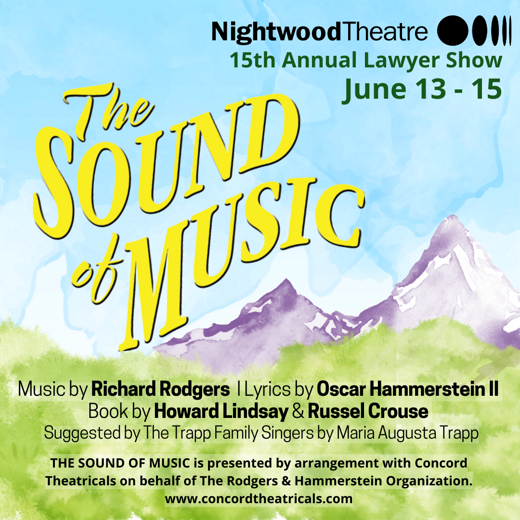
Nightwood Theatre's 2024 Lawyer Show: The Sound of Music
The St. Lawrence Centre for the Arts (6/13 - 6/15) | |

|
Shrek the Musical (Non-Equity)
Princess of Wales Theatre (8/6 - 8/18) | |

|
SPIN - in concert
Guild Festival Theatre (7/6 - 7/6) | |

|
The Monkey Show
Wychwood Theatre (6/4 - 6/5) | |

|
Wicked
Princess of Wales Theatre (6/5 - 7/21) | |

|
Brampton's Own Shakespeare Show: Taming of the Shrew
Brampton On Stage (7/18 - 8/3) | |

|
Harbourfront Centre Celebrates 50 Years of Arts, Culture and Unity with an Exciting Summer Lineup of Anniversary Events and Long Weekend Festivals
Harbourfront Centre (6/1 - 8/28) | |
| VIEW SHOWS ADD A SHOW | ||
Recommended For You

